

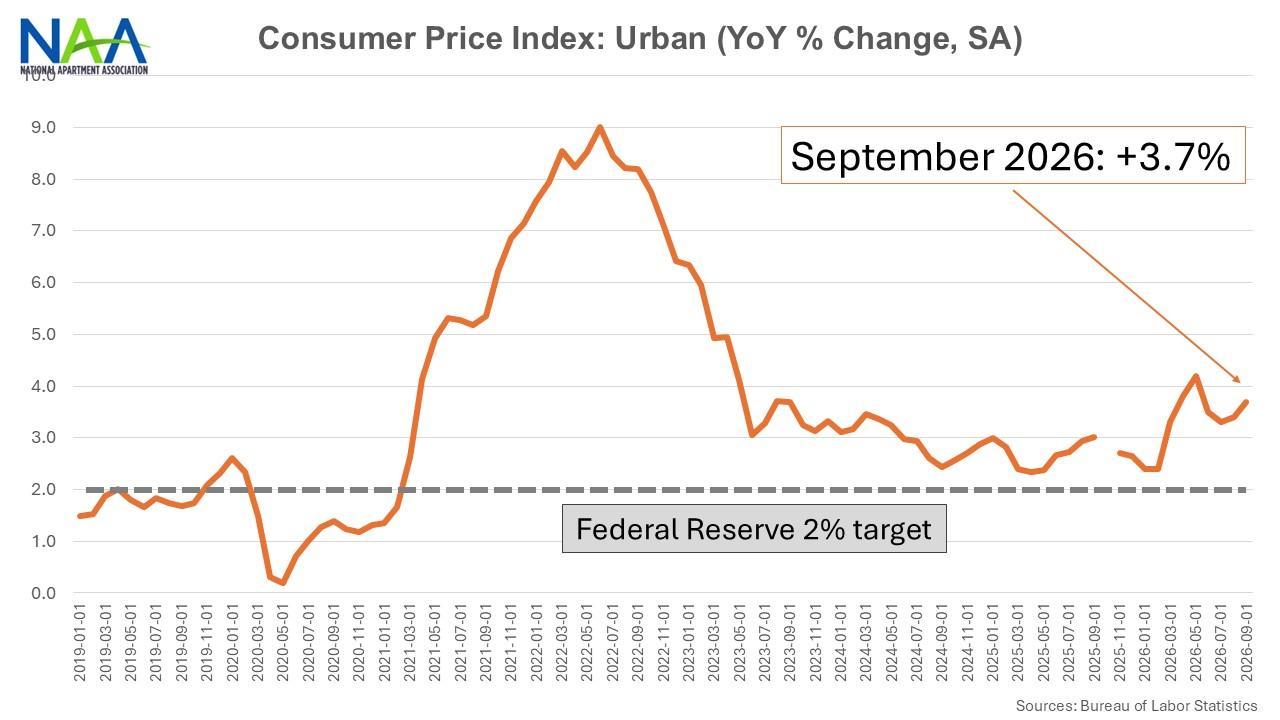
Consumer prices rose again in October, adding pressure to household budgets even as the monthly pace eased from September. The Bureau of Labor Statistics reported a seasonally adjusted 0.4 percent increase in the Consumer Price Index for All Urban Consumers, following a 0.6 percent rise the previous month.
Prices excluding food and energy increased 0.3 percent. That core measure matched its monthly increases in September and August. The November 10 release therefore showed continuing inflation across a broad basket of purchases, rather than a return to unchanged prices.
The report also carries an unusual limitation. BLS did not collect October 2025 survey data during a lapse in federal appropriations, leaving many indexes without the comparison point needed to calculate their usual October 2026 year-over-year changes.
Food, shelter and energy remain important
The shelter index increased 0.3 percent and accounted for more than 30 percent of the overall monthly increase. Food prices rose 0.5 percent, with groceries up 0.4 percent and food away from home up 0.5 percent. Energy increased 0.7 percent after a substantially larger September rise.
BLS also reported increases in categories including medical care, recreation, motor vehicle insurance and household furnishings and operations. Used cars and trucks and communication were among the categories that fell. The direction of the overall index does not mean every individual price moved upward.
For households, that mix matters. A family facing higher rent, insurance and grocery bills may experience little immediate relief from a decline in an item it does not buy. The national index describes an average basket, while actual spending patterns differ across consumers.
Slower inflation is still an increase in prices
A decline in the monthly inflation rate from 0.6 percent to 0.4 percent means prices increased more slowly. It does not mean the overall price level fell. The distinction is especially relevant when people compare economic headlines with bills that remain higher than before.
The CPI measures changes in prices paid by urban consumers for goods and services. BLS weights categories using information about consumer spending, so a movement in a major budget item can have more influence on the overall index than a similar movement in a small category.
Seasonal adjustment is another part of the comparison. It is designed to account for recurring patterns that can make one month look different from another for predictable reasons. The reported 0.4 percent figure is the seasonally adjusted monthly change, not an annual rate.
Core inflation excludes food and energy to help examine movements outside those often volatile categories. That analytical measure does not imply that food and energy are unimportant to households. Both remain part of the headline index and can dominate a family's immediate experience of rising costs.
The missing annual comparison needs care
Normally, an October release allows readers to compare prices with the same month a year earlier. This time, the missing October 2025 observations prevent BLS from publishing that calculation for indexes without an available starting point. The limitation should stay visible whenever the figures are summarized.
BLS provides guidance on approximating missing data points, but an approximation is not the same thing as an official observed index. A privately calculated annual estimate should be identified as such, with its assumptions explained. It should not be presented as the agency's published annual inflation rate.
Nor can a reliable annual comparison be created simply by multiplying the October monthly change by twelve. Monthly changes vary, and compounding matters. Such arithmetic would answer a hypothetical question about a repeated pace, not reconstruct the missing year-earlier observation.
The data gap therefore limits one familiar comparison without invalidating every figure in the current release. Readers can still examine the reported monthly movements and the available category data, provided they keep the measurement period and the missing baseline clear.
What the report means for policy and budgets
Inflation figures receive close attention because the Federal Reserve seeks stable prices alongside maximum employment. Its longer-run 2 percent inflation objective is expressed in terms of the personal consumption expenditures price index, a separate measure from CPI. The two should not be treated as interchangeable.
The Fed explains that PCE and CPI differ in their construction and treatment of spending patterns. CPI still provides important information about consumer prices, but one release does not mechanically determine the next interest-rate decision. Policymakers assess a wider set of economic evidence.
For consumers, the immediate implication is more direct: the average basket became more expensive during October. Whether wages, benefits or other income kept pace requires separate evidence. The CPI release alone cannot establish that every household became better or worse off by the same amount.
A monthly rise measures price changes, not the level of household income.
As of November 11, the verified figures are a 0.4 percent monthly headline increase and a 0.3 percent core increase. The annual comparison remains constrained by missing data. Those facts describe persistent price pressure without inventing an official year-over-year number or forecasting a policy decision.